Model Log-Linear (Bagian 1) Dr. Kusman Sadik, M.Si Program Studi Magister (S2) Departemen Statistika IPB, 2017/2018
|
|
|
- Lanny Kartawijaya
- 6 tahun lalu
- Tontonan:
Transkripsi

 Departemen Statistika")
1 Model Log-Linear (Bagian 1) Dr. Kusman Sadik, M.Si Program Studi Magister (S2) Departemen Statistika IPB, 2017/2018
2 Using a log-linear modeling approach is advantageous to conducting inferential tests of the associations in contingency tables because the models can handle more complicated situations. For example, the Breslow Day statistic is limited to 2x2xK tables and estimates of common odds ratios cannot be obtained for tables larger than 2x2. Conversely, a log-linear modeling approach is not restricted to two- or three-way tables so it can be used for testing homogeneous association and estimating common odds ratios in tables of any size. 2
3 Log-linear models are used to model the cell counts in contingency tables. The ultimate goal of fitting a log-linear model is to estimate parameters that describe the relationships between categorical variables. Specifically, for a set of categorical variables, log-linear models do not really distinguish between explanatory and response variables but rather treat all variables as response variables by modeling the cell counts for all combinations of the levels of the categorical variables included in the model. 3
4 In general, the number of parameters in a log-linear model depends on the number of categories of the variables of interest. More specifically, in any log-linear model the effect of a categorical variable with a total of C categories requires (C 1) unique parameters. For example, if variable X is gender (with two categories), then C = 2 and only one predictor, thus one parameter, is needed to model the effect of X. 4
5 When dummy coding is used, the last category of the variable is used as a reference category. Therefore, the parameter associated with the last category is set to zero, and each of the remaining parameters of the model is interpreted relative to the last category. For example, if male is the last category of the gender variable, then the one gender parameter in the log-linear model will be interpreted as the difference between females and males because the parameter reflects the odds for females relative to the reference category, males. 5
6 6
7 Instead of representing the parameter associated with the i th variable (X i ) as β i, in log-linear models this parameter is represented by the Greek letter lambda, λ, with the variable indicated in the superscript and the (dummy-coded) indicator of the variable in the subscript. For example, if the variable X has a total of I categories (i = 1, 2,, I), λ i x is the parameter associated with the i th indicator (dummy variable) for X. Similarly, if the variable Y has a total of J categories (j = 1, 2,, J), then λ jy is the parameter associated with the j th indicator for Y. 7
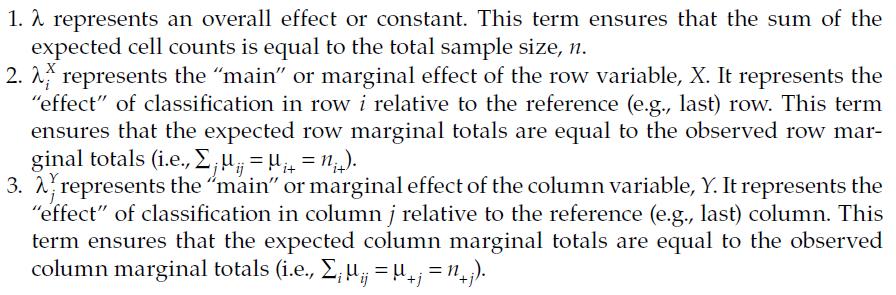
8 For two categorical variables, the expected cell counts, denoted by μ ij for the cell in the i th row and j th column, are the outcome values from a log-linear model. μij = Eij = (ni+) (n+j)/ (n++) 8
9 9
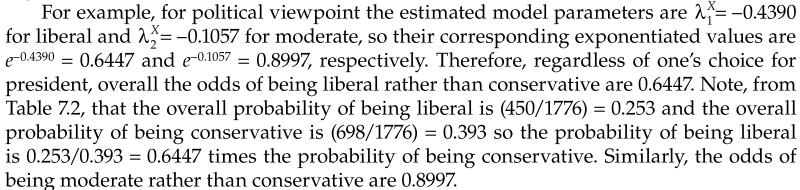
10 In general, main effects in log-linear models are interpreted as odds. The (exponentiated) parameter values associated with X, λ i x, can be interpreted as the odds of being in the i th row versus being in the last row of the table regardless of the value of the other variable, Y. Likewise, the (exponentiated) parameter values associated with Y, λ jy, can be interpreted as the odds of being in the j th column versus being in the last column of the table regardless of the value of the other variable, X. 10
11 Lihat : Azen, hlm
12 i = 1, 2,..., k : kategori terakhir (i = k) sebagai referensi j = 1, 2,..., m : kategori terakhir (j = m) sebagai referensi λ i X = log odds i = log P X=i P X=k λ j Y = log odds j = log P Y=j P Y=m = log n i./n.. n k. /n.. = log n.j /n.. n.m /n.. 12
13 Data : Azen, Table.7.2 λ i X = log odds i = log P X=i P X=k = log n i./n.. n k. /n.. λ 1 X = log P X=1 P X=3 λ 2 X = log P X=2 P X=3 λ 3 X = log P X=3 P X=3 = log n 1./n.. = log 450/1776 n 3. /n.. 698/1776 = log n 2./n.. = log 628/1776 n 3. /n.. 698/1776 = log n 3./n.. n 3. /n.. = log 1 = 0 = =
14 λ j Y = log odds j = log P Y=j P Y=m = log n.j /n.. n.m /n.. λ 1 Y = log P Y=1 P Y=3 λ 2 Y = log P Y=2 P Y=3 λ 3 Y = log P Y=3 P Y=3 = log n.1/n.. = log 647/1776 n.3 /n.. 274/1776 = log n.2/n.. = log 855/1776 n.3 /n.. 274/1776 = log n.3/n.. n.3 /n.. = log 1 = 0 = =
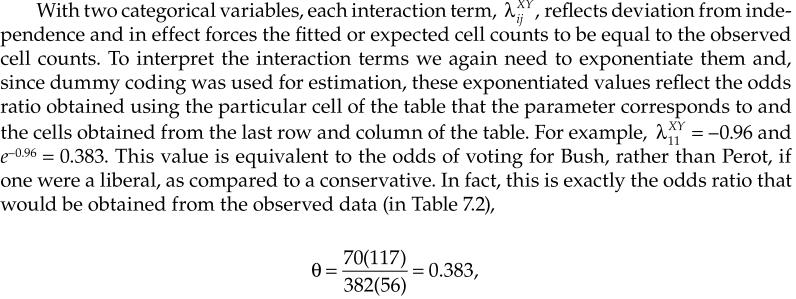
15 Bagaimana menduga λ? Gunakan kategori terakhir untuk X dan Y, untuk data di atas (i=3 dan j=3), sehingga: log(μ 33 ) = λ, karena λ 3 X = λ 3 Y = 0 μ 33 = (n 3. ) (n.3 )/ (n.. ) = (274)(698)/(1776) = λ = log(μ 33 ) = log( ) =
16 16
17 17
18 18
19 Program R : Wajib Program SAS : Tambahan 19
20 ** Model Log-Linear untuk Data Tabel 7.2 (Azen, hlm.140) ** ** relevel --> Memilih Kategori Referensi ** ** Model 1 : Tanpa Interaksi ** pol <- factor(rep(c("1lib","2mod","3con"),3)) pre <- factor(rep(c("1bus","2cli","3per"),rep(3,3))) count <- c(70, 195, 382, 324, 332, 199, 56, 101, 117) pol pre <- relevel(pol, ref="3con") <- relevel(pre, ref="3per") data.frame(pol, pre, count) model1 <- glm(count ~ pol + pre, family=poisson("link"=log)) summary(model1) dugaan <- round(fitted(model1),2) data.frame(pol,pre, count, dugaan) 20
21 pol pre count 1 1Lib 1Bus Mod 1Bus Con 1Bus Lib 2Cli Mod 2Cli Con 2Cli Lib 3Per Mod 3Per Con 3Per
22 Coefficients: Estimate Std. Error z value Pr(> z ) (Intercept) < 2e-16 *** pol1lib e-13 *** pol2mod pre1bus < 2e-16 *** pre2cli < 2e-16 *** --- Signif. codes: 0 *** ** 0.01 * (Dispersion parameter for poisson family taken to be 1) Null deviance: on 8 degrees of freedom Residual deviance: on 4 degrees of freedom AIC:
23 pol pre count dugaan 1 1Lib 1Bus Mod 1Bus Con 1Bus Lib 2Cli Mod 2Cli Con 2Cli Lib 3Per Mod 3Per Con 3Per
24 When there is evidence for dependency between the row and column variables of a two-way table, the dependency is modeled using two-way interaction terms in the log-linear modeling framework. However, fitting a log-linear model with a two-way interaction to a two-way contingency table is analogous to fitting the saturated model. To illustrate the saturated model using the previous example: 24
25 25
26 26
27 ** Model Log-Linear untuk Data Tabel 7.2 (Azen, hlm.140) ** ** relevel --> Memilih Kategori Referensi ** ** Model 2 : Ada Interaksi ** pol <- factor(rep(c("1lib","2mod","3con"),3)) pre <- factor(rep(c("1bus","2cli","3per"),rep(3,3))) count <- c(70, 195, 382, 324, 332, 199, 56, 101, 117) pol pre <- relevel(pol, ref="3con") <- relevel(pre, ref="3per") data.frame(pol, pre, count) Model1 <- glm(count ~ pol + pre + pol*pre, family=poisson("link"=log)) summary(model1) dugaan <- round(fitted(model1),2) data.frame(pol,pre, count, dugaan) 27
28 Coefficients: Estimate Std. Error z value Pr(> z ) (Intercept) < 2e-16 *** pol1lib e-06 *** pol2mod pre1bus < 2e-16 *** pre2cli e-06 *** pol1lib:pre1bus e-06 *** pol2mod:pre1bus ** pol1lib:pre2cli e-11 *** pol2mod:pre2cli e-05 *** --- Signif.codes: 0 *** ** 0.01 * (Dispersion parameter for poisson family taken to be 1) Null deviance: e+02 on 8 degrees of freedom Residual deviance: e-14 on 0 degrees of freedom AIC:
29 29
30 1. Gunakan Program R untuk menganalisis data yang terdapat pada Tabel 7.2 (Azen, hlm.140) : a. Lakukan pemodelan log-linear dengan menjadikan Conservative dan Perot sebagai pembanding/referensi. Apa interpretasinya? b. Lakukan pemodelan log-linear dengan menjadikan Liberal dan Bush sebagai pembanding/referensi. Apa interpretasinya? c. Berdasarkan dua pendekatan tersebut (a dan b), tentukan penduga bagi ij, untuk i = 1, 2, 3 dan j = 1, 2, 3. Apakah hasilnya berbeda antara (a) dan (b) di atas? d. Lakukan uji hipotesis untuk mengetahui ada tidaknya hubungan antara afiliasi politik dengan pilihan menggunakan model penuh (saturated model). Apa kesimpulan Anda? 30
31 2. Gunakan Program R untuk melakukan analisis data pada Tabel 2 dibawah ini: a. Tentukan model log-linear dan dugaan parameternya. Apa interpretasinya? b. Berdasarkan model tersebut, tentukan penduga bagi ij, untuk i = 1, 2, 3 dan j = 1, 2, 3, 4. c. Lakukan uji hipotesis untuk mengetahui ada tidaknya hubungan antara afiliasi politik dengan umur menggunakan model penuh (saturated model). Apa kesimpulan Anda? 31
32 2. 32
. Categorical Data Analysis 2 nd. New York: Wiley. 3.")
33 Pustaka 1. Azen, R. dan Walker, C.R. (2011). Categorical Data Analysis for the Behavioral and Social Sciences. Routledge, Taylor and Francis Group, New York. 2. Agresti, A. (2002). Categorical Data Analysis 2 nd. New York: Wiley. 3. Pustaka lain yang relevan. 33
34 Bisa di-download di kusmansadik.wordpress.com 34
35 Terima Kasih 35
Model Log-Linear (Bagian 2) Dr. Kusman Sadik, M.Si Program Studi Magister (S2) Departemen Statistika IPB, 2017/2018
 Dr. Kusman Sadik, M.Si Program Studi Magister (S2) Departemen Statistika IPB, 2017/2018") Model Log-Linear (Bagian 2) Dr. Kusman Sadik, M.Si Program Studi Magister (S2) Departemen Statistika IPB, 2017/2018 When fitting log-linear models to higher-way tables it is typical to only consider models
Model Log-Linear (Bagian 2) Dr. Kusman Sadik, M.Si Program Studi Magister (S2) Departemen Statistika IPB, 2017/2018 When fitting log-linear models to higher-way tables it is typical to only consider models
Pemodelan Data Cacahan (Count Data) dalam GLM. Dr. Kusman Sadik, M.Si Sekolah Pascasarjana Departemen Statistika IPB Semester Genap 2017/2018
 dalam GLM. Dr. Kusman Sadik, M.Si Sekolah Pascasarjana Departemen Statistika IPB Semester Genap 2017/2018") Pemodelan Data Cacahan (Count Data) dalam GLM Dr. Kusman Sadik, M.Si Sekolah Pascasarjana Departemen Statistika IPB Semester Genap 2017/2018 Pendahuluan Pada model linear klasik, seperti regresi linear,
Pemodelan Data Cacahan (Count Data) dalam GLM Dr. Kusman Sadik, M.Si Sekolah Pascasarjana Departemen Statistika IPB Semester Genap 2017/2018 Pendahuluan Pada model linear klasik, seperti regresi linear,
Dr. Kusman Sadik, M.Si Departemen Statistika IPB, 2017
 Dr. Kusman Sadik, M.Si Departemen Statistika IPB, 2017 1 Pada model linear klasik, seperti regresi linear, memerlukan asumsi bahwa peubah respon y menyebar Normal. Pada kenyataanya banyak ditemukan bahwa
Kasus. Survey terhadap remaja usia tahun apakah pernah melakukan kerja paruh waktu (part-time)??
??") Kasus Survey terhadap remaja usia 15-16 tahun apakah pernah melakukan kerja paruh waktu (part-time)?? Berikut Tabel datanya: Race Gender Yes Part Time Job No White Male 43 134 Female 26 149 Black Male
Kasus Survey terhadap remaja usia 15-16 tahun apakah pernah melakukan kerja paruh waktu (part-time)?? Berikut Tabel datanya: Race Gender Yes Part Time Job No White Male 43 134 Female 26 149 Black Male
Sering dibahas. Asosiasi 2 peubah Y Z
 Sering dibahas X Asosiasi 2 peubah Y X Y Z Confounding In statistics, a confounding variable (also confounding factor, a confound, or confounder) is an extraneous variable in a statistical model that correlates
Pertemuan 10 STATISTIKA INDUSTRI 2. Multiple Linear Regression. Multiple Linear Regression. Multiple Linear Regression 19/04/2016
 19/04/016 Pertemuan 10 STATISTIKA INDUSTRI TIN 4004 Outline: and Correlation Non Linear Regression Referensi: Montgomery, D.C., Runger, G.C., Applied Statistic and Probability for Engineers, 5 th Ed. John
Regresi Logistik Nominal dengan Fungsi Hubung CLOGLOG
 Regresi Logistik Nominal dengan Fungsi Hubung CLOGLOG Julio Adisantoso, G16109011/STK 11 Mei 2010 Ringkasan Regresi logistik merupakan suatu pendekatan pemodelan yang dapat digunakan untuk mendeskripsikan
Model Regresi untuk Data Deret Waktu. Kuliah 8 Metode Peramalan Deret Waktu
 Model Regresi untuk Data Deret Waktu Kuliah 8 Metode Peramalan Deret Waktu r.rahma.anisa@gmail.com Review Salah satu asumsi regresi linear klasik: cov e i, e j = 0 dengan e i menunjukkan galat pengamatan
Inferensia Statistik parametrik VALID?? darimana sampel diambil
 Inferensia Statistik parametrik VALID?? Tergantung dari bentuk populasi Tergantung dari bentuk populasi darimana sampel diambil Uji kesesuaian (goodness of fit) ) untuk tabel frekuensi Goodness-of-fit
BAB 4 HASIL DAN PEMBAHASAN. mahasiswa lulusan yang berasal dari School of Computer Science BINUS. datanya adalah seperti yang tertera pada Tabel 4.1.
 BAB 4 HASIL DAN PEMBAHASAN 4.1 Hasil Analisis Data dan Pembahasan Jumlah keseluruhan data yang peneliti peroleh adalah sebanyak 718 data mahasiswa lulusan yang berasal dari School of Computer Science BINUS
Gambaran Duplikasi Penomoran Rekam Medis. Gambaran Kualifikasi Pendidikan. Gambaran Pengetahuan. Statistics pemberian nomor. N Valid 60.
 Gambaran Duplikasi Penomoran Rekam Medis Statistics N Valid 60 Missing 0 Frequency Percent Valid Percent Cumulative Percent Valid duplikasi 24 40.0 40.0 40.0 tidak duplikat 36 60.0 60.0 100.0 Total 60
E-Jurnal Matematika Vol. 2, No.2, Mei 2013, ISSN:
 E-Jurnal Matematika Vol., No., Mei 013, 37-41 ISSN: 303-1751 PENERAPAN REGRESI QUASI-LIKELIHOOD PADA DATA CACAH (COUNT DATA) YANG MENGALAMI OVERDISPERSI DALAM REGRESI POISSON (Studi Kasus: Jumlah Kasus
Statistik Bisnis. Week 13 Chi-Square Test
 Statistik Bisnis Week 13 Chi-Square Test Learning Objectives In this chapter, you learn: How and when to use the chi-square test for contingency tables TEST FOR THE DIFFERENCE BETWEEN TWO PROPORTIONS Contingency
Marketing Research Data Analyses
 Marketing Research Data Analyses Tujuan Uji Z untuk dua roorsi yang berbeda (samle bersifat indeendent) Uji χ untuk dua roorsi yang berbeda (samle bersifat indeendent) Uji χ untuk c roorsi yang berbeda
Lampiran Hasil Output SPSS. Statistics. Skor Kepuasan Pasien Rawat Jalan. Valid 200 Missing 0 Mean Skor Kepuasan Pasien Rawat Jalan Frequenc y
 1 Lampiran Hasil Output SPSS A. Analisis Univariat 1. Kepuasan Pasien Statistics Skor Kepuasan Pasien Rawat Jalan 200 Missing 0 Mean 46.73 Skor Kepuasan Pasien Rawat Jalan Frequenc y Cumulative 39 4 2.0
Statistik Bisnis 1. Week 9 Discrete Probability
 Statistik Bisnis 1 Week 9 Discrete Probability Random Variables Random Variables Discrete Random Variable Continuous Random Variable Wk. 9 Wk. 10 Probability Distributions Probability Distributions Wk.
Analisis Chi-Square (x 2 )
") Analisis Chi-Square (x 2 ) Chi square ("χ 2 " dari huruf Yunani "Chi "Kai") to determine if data good or not. Expl... to determine possible outcomes for genetic crosses. How will we know if our fruit fly
Analisis Chi-Square (x 2 ) Chi square ("χ 2 " dari huruf Yunani "Chi "Kai") to determine if data good or not. Expl... to determine possible outcomes for genetic crosses. How will we know if our fruit fly
Dr. Kusman Sadik, M.Si Departemen Statistika IPB, 2016
 1 Dr. Kusman Sadik, M.Si Departemen Statistika IPB, 2016 This part presents some basic statistical methods essential to modeling, analyzing, and forecasting time series data. Both graphical displays and
ANALISIS FAKTOR-FAKTOR YANG MEMPENGARUHI KEPUTUSAN KONSUMEN MEMBELI SUATU PRODUK DENGAN METODE ANALISIS REGRESI LOGISTIK ORDINAL
 J u r n a l E K B I S / V o l. V I / N o. / e d i s i M a r e t 2 0 2 379 ANALISIS FAKTOR-FAKTOR YANG MEMPENGARUHI KEPUTUSAN KONSUMEN MEMBELI SUATU PRODUK DENGAN METODE ANALISIS REGRESI LOGISTIK ORDINAL
HUBUNGAN ANTAR PEUBAH
 HUBUNGAN ANTAR PEUBAH DALAM ANALISIS INGIN DIKETAHUI ATAU DIEVALUASI HUBUNGAN ATAU KETERKAITAN ANTAR PEUBAH Hubungan Antar Peubah Besarnya gaji Lama bekerja 1 Hubungan Antar Peubah (lanjutan) Pendapatan
Lampiran 2. Fungsi dari masing-masing pernyataan yang digunakan dalam PROC MIXED
 LAMPIRAN Lampiran. Bentuk Umum Dari PROC MIXED PROC MIXED pilihan-pilihan ; BY nama-nama peubah ; CLASS nama-nama peubah ; ID nama-nama peubah; MODEL peubah respon = nama-nama peubah / pilihan-pilihan
ANALISIS RANCANGAN BUJUR SANGKAR GRAECO LATIN
 ANALISIS RANCANGAN BUJUR SANGKAR GRAECO LATIN SKRIPSI Disusun Oleh: YUYUN NAIFULAR J2E009052 JURUSAN STATISTIKA FAKULTAS SAINS DAN MATEMATIKA UNIVERSITAS DIPONEGORO SEMARANG 2013 ANALISIS RANCANGAN BUJUR
Statistik Bisnis 2. Week 6 Two-Sample Test Population Proportions and Variances
 Statistik Bisnis Week 6 Two-Samle Test Poulation Proortions and Variances Learning Objectives The means of two indeendent oulations The means of two related oulations In this chater, you learn how to use
Statistika Farmasi
 Bab 4: Uji Hipotesis Statistika FMIPA Universitas Islam Indonesia Uji Hipotesis Hipotesis Suatu pernyataan tentang besarnya nilai parameter populasi yang akan diuji. Pernyataan tersebut masih lemah kebenarannya
(Studi Kasus Siswa SMP Kelas VIII di SMPN 1 Tajinan Malang) *Wuri Graita Gayuh Palupi *Abadyo
 *Wuri Graita Gayuh Palupi *Abadyo") PERBANDINGAN REGRESI MODEL LOGISTIK BINER DENGAN REGRESI MODEL PROBIT TERHADAP FAKTOR-FAKTOR YANG MEMPENGARUHI SIKAP SISWA SMP PADA MATA PELAJARAN MATEMATIKA (Studi Kasus Siswa SMP Kelas VIII di SMPN 1
PERBANDINGAN REGRESI MODEL LOGISTIK BINER DENGAN REGRESI MODEL PROBIT TERHADAP FAKTOR-FAKTOR YANG MEMPENGARUHI SIKAP SISWA SMP PADA MATA PELAJARAN MATEMATIKA (Studi Kasus Siswa SMP Kelas VIII di SMPN 1
Non Linear Estimation and Maximum Likelihood Estimation
 Non Linear Estimation and Maximum Likelihood Estimation Non Linear Estimation and Maximum Likelihood Estimation Non Linear Estimation We have studied linear models in the sense that the parameters are
Relevansi-Nilai Kredit. Tahun
 Lampiran 1 Model Penelitian Hipotesis 1a, 1b, dan 2 Laba Bersih Pendapatan Komprehensif Lain Peringkat Obligasi Laba Komprehensif Lampiran 2 Model Penelitian Hipotesis 3a, 3b, dan 3c Relevansi-Nilai Kredit
Statistik Bisnis 2. Week 4 Fundamental of Hypothesis Testing Methodology
 Statistik Bisnis 2 Week 4 Fundamental of Hypothesis Testing Methodology ONE-TAIL TESTS One-Tail Tests In many cases, the alternative hypothesis focuses on a particular direction H 0 : μ 3 H 1 : μ < 3 H
Statistik Bisnis 1. Week 9 Discrete Probability Binomial and Poisson Distribution
 Statistik Bisnis 1 Week 9 Discrete Probability Binomial and Poisson Distribution Agenda 15 minutes 45 minutes 30 minutes Attendance check Discussion Exercise Learning Objectives In this chapter, you learn:
To test the significant effect of two independent variables to one dependent variable, and to test the significant interaction of the two independent
 TWO-WAY ANOVA To test the significant effect of two independent variables to one dependent variable, and to test the significant interaction of the two independent variables to the dependent variable.
KUESIONER PENELITIAN
 KUESIONER PENELITIAN PENGARUH KOMPONEN KOMUNIKASI DALAM PELAKSANAAN PREVENTION MOTHER TO CHILD TRANSMISSION (PMTCT) OLEH BIDAN TERHADAP KUNJUNGAN KLIEN PADA PELAYANAN VOLUNTARY COUNCELLING AND TEST (VCT)
PENERAPAN REGRESI ZERO-INFLATED NEGATIVE BINOMIAL (ZINB) UNTUK PENDUGAAN KEMATIAN ANAK BALITA
 UNTUK PENDUGAAN KEMATIAN ANAK BALITA") E-Jurnal Matematika Vol. 2, No.4, Nopember 2013, 11-16 ISSN: 2303-1751 PENERAPAN REGRESI ZERO-INFLATED NEGATIVE BINOMIAL (ZINB) UNTUK PENDUGAAN KEMATIAN ANAK BALITA NI MADE SEKARMINI 1, I KOMANG GDE SUKARSA
E-Jurnal Matematika Vol. 2, No.4, Nopember 2013, 11-16 ISSN: 2303-1751 PENERAPAN REGRESI ZERO-INFLATED NEGATIVE BINOMIAL (ZINB) UNTUK PENDUGAAN KEMATIAN ANAK BALITA NI MADE SEKARMINI 1, I KOMANG GDE SUKARSA
GEOGRAPHICALLY WEIGHTED REGRESSION PRINCIPAL COMPONENT ANALYSIS (GWRPCA) PADA PEMODELAN PENDAPATAN ASLI DAERAH DI JAWA TENGAH
 PADA PEMODELAN PENDAPATAN ASLI DAERAH DI JAWA TENGAH") GEOGRAPHICALLY WEIGHTED REGRESSION PRINCIPAL COMPONENT ANALYSIS (GWRPCA) PADA PEMODELAN PENDAPATAN ASLI DAERAH DI JAWA TENGAH SKRIPSI Disusun Oleh : NURMALITA SARI 240102120008 DEPARTEMEN STATISTIKA FAKULTAS
GEOGRAPHICALLY WEIGHTED REGRESSION PRINCIPAL COMPONENT ANALYSIS (GWRPCA) PADA PEMODELAN PENDAPATAN ASLI DAERAH DI JAWA TENGAH SKRIPSI Disusun Oleh : NURMALITA SARI 240102120008 DEPARTEMEN STATISTIKA FAKULTAS
Data Structures. Class 4 Arrays. Pengampu : TATI ERLINA, M.I.T. Copyright 2006 by The McGraw-Hill Companies, Inc. All rights reserved.
 Data Structures Class 4 Arrays Pengampu : TATI ERLINA, M.I.T. McGraw-Hill Technology Education Copyright 2006 by The McGraw-Hill Companies, Inc. All rights reserved. DESKRIPSI Bayangkan jika kita memiliki
UJI HOMOGENITAS MARGINAL DENGAN MODEL LOG LINIER PADA TABEL KONTINGENSI TIGA DIMENSI ATAU LEBIH
 UJI HOMOGENITAS MARGINAL DENGAN MODEL LOG LINIER PADA TABEL KONTINGENSI TIGA DIMENSI ATAU LEBIH SKRIPSI ELFRIEDE MAHULAE 070823033 DEPARTEMEN MATEMATIKA FAKULTAS MATEMATIKA DAN ILMU PENGETAHUAN ALAM UNIVERSITAS
PEMAKAIAN VARIABEL INDIKATOR DALAM PEMODELAN. Mike Susmikanti *
 PEMAKAIAN VARIABEL INDIKATOR DALAM PEMODELAN Mike Susmikanti * ABSTRAK PEMAKAIAN VARIABEL INDIKATOR DALAM PEMODELAN. Pemodelan dalam penelitian berbagai bidang khususnya bidang industri, merupakan kebutuhan
E-Jurnal Matematika Vol. 3 (3), Agustus 2014, pp ISSN:
, Agustus 2014, pp ISSN:") E-Jurnal Matematika Vol. 3 3), Agustus 2014, pp. 107-115 ISSN: 2303-1751 PERBANDINGAN REGRESI BINOMIAL NEGATIF DAN REGRESI GENERALISASI POISSON DALAM MENGATASI OVERDISPERSI Studi Kasus: Jumlah Tenaga Kerja
E-Jurnal Matematika Vol. 3 3), Agustus 2014, pp. 107-115 ISSN: 2303-1751 PERBANDINGAN REGRESI BINOMIAL NEGATIF DAN REGRESI GENERALISASI POISSON DALAM MENGATASI OVERDISPERSI Studi Kasus: Jumlah Tenaga Kerja
Statistik Bisnis 1. Week 2 Collecting and Organizing Data
 Statistik Bisnis 1 Week 2 Collecting and Organizing Data Agenda Time Activity 15 minutes Attendance check 15 minutes Review last week material 70 minutes Discussion REVIEW 1.4 Untuk masing-masing variabel
LAMPIRAN. Universitas Sumatera Utara
 LAMPIRAN Lampiran 1: Analisis Logit Iteration Step 1 1-2 Log likelihoo d Coefficients Iteration History(a,b,c,d) Constant X1 X2 X3 X4 X5 X6 X7 X8 X9 31.228-2.194.035 -.231 -.080 -.014.819 -.660.443.559
METODE REGRESI DATA PANEL UNTUK PERAMALAN KONSUMSI ENERGI DI INDONESIA
 METODE REGRESI DATA PANEL UNTUK PERAMALAN KONSUMSI ENERGI DI INDONESIA SKRIPSI Oleh: MARISKA SRIHARDIANTI 24010212130036 JURUSAN STATISTIKA FAKULTAS SAINS DAN MATEMATIKA UNIVERSITAS DIPONEGORO SEMARANG
DAFTAR LAMPIRAN. Wawancara Terhadap Bidang Standarisasi pada. LSP LSK TKI Sektor Tata Laksana Rumah Tangga : Ibu Etty. Meindrati
 DAFTAR LAMPIRAN Wawancara Terhadap Bidang Standarisasi pada LSP LSK TKI Sektor Tata Laksana Rumah Tangga : Ibu Etty Meindrati 1. Apakah bisa BLKLN tidak mempunyai berkas pendaftaran ujian? Bisa saja, karena
MENENTUKAN MODEL KOEFISIEN REGRESI MULTIPLE VARIABEL DENGAN MENGGUNAKAN MAKSIMUM LIKELIHOOD SKRIPSI BENNY SOFYAN SAMOSIR
 MENENTUKAN MODEL KOEFISIEN REGRESI MULTIPLE VARIABEL DENGAN MENGGUNAKAN MAKSIMUM LIKELIHOOD SKRIPSI BENNY SOFYAN SAMOSIR 080823004 DEPARTEMEN MATEMATIKA FAKULTAS MATEMATIKA DAN ILMU PENGETAHUAN ALAM UNIVERSITAS
PENDEKATAN MULTIPLE REGRESI PADA ANALISIS RAGAM KLASIFIKASI DUA ARAH SKRIPSI MARISA INDA PUTRI
 PENDEKATAN MULTIPLE REGRESI PADA ANALISIS RAGAM KLASIFIKASI DUA ARAH SKRIPSI MARISA INDA PUTRI 080823023 DEPARTEMEN MATEMATIKA FAKULTAS MATEMATIKA DAN ILMU PENGETAHUAN ALAM UNIVERSITAS SUMATERA UTARA MEDAN
Lampiran : 1 PERNYATAAN KESEDIAAN MENJADI RESPONDEN. Saya yang bertandatangan dibawah ini:
 Lampiran : 1 PERNYATAAN KESEDIAAN MENJADI RESPONDEN Saya yang bertandatangan dibawah ini: Nama Umur Alamat :. :. :. Setelah mendapatkan penjelasan tentang penelitian ini maka saya menyatakan bersedia berpartisipasi
ABSTRAK. Kata-kata Kunci: Financial Distress, Rasio Keuangan, Altman Z-Score.
 ABSTRAK Perusahaan adalah organisasi yang mencari keuntungan sebagai tujuan utamanya, oleh karena itu perusahaan harus memiliki pengendalian terhadap kegiatan operasional terutama berkaitan dengan keuangan
MODEL REGRESI PROBIT BIVARIAT
 MODEL REGRESI PROBIT BIVARIAT NURFIDAH DWITIYANTI Program Studi Teknik Informatika Fakultas Teknik, Matematika dan Ilmu Pengetahuan Alam Universitas Indraprasta PGRI Jl. Nangka No. 58 C, Tanjung Barat,
E-Jurnal Matematika Vol. 2, No.3, Agustus 2013, ISSN:
 E-Jurnal Matematika Vol. 2, No.3, Agustus 2013, 23-28 ISSN: 2303-1751 PENERAPAN REGRESI ZERO INFLATED POISSON UNTUK MENGATASI OVERDISPERSI PADA REGRESI POISSON (Studi Kasus: Ketidaklulusan Siswa SMA/MA
KUESIONER PENELITIAN
 92 KUESIONER PENELITIAN HUBUNGAN FAKTOR PREDISPOSISI, PENDUKUNG DAN PENGUAT DENGAN TINDAKAN PENGGUNAAN KONDOM PADA WPS UNTUK PENCEGAHAN HIV/AIDS DI KABUPATEN SERDANG BEDAGAI TAHUN 2012 I. IDENTITAS RESPONDEN
I. Identitas Responden
 81 Lampiran 1 KUESIONER PENELITIAN PENGARUH KARAKTERISTIK, AKTIFITAS FISIK DAN PENAMBAHAN BERAT BADAN IBU HAMIL TERHADAP KEJADIAN PREEKLAMSIA DI RSUD RANTAU PRAPAT Kasus Kontrol I. Identitas Responden
KUESIONER PENELITIAN
 KUESIONER PENELITIAN FAKTOR-FAKTOR YANG MEMENGARUHI PEMAKAIAN METODE AMENOREA LAKTASI SEBAGAI KONTRASEPSI PADA IBU MENYUSUI DI PUSKESMAS DATUK BANDAR KOTA TANJUNGBALAITAHUN 2016 Nama Pewawancara : Hari/
KEPERCAYAAN DIRI. Corrected Item-Total Correlation
 LAMPIRAN 61 KEPERCAYAAN DIRI PUTARAN 1 N % Cases Valid 60 100.0 Excluded( a) 0.0 Total 60 100.0 a Listwise deletion based on all variables in the procedure. Reliability Statistics Alpha N of Items.756
Uji OR dan Regresi Logistik Sederhana
 Uji OR dan Regresi Logistik Sederhana Pada kesempatan ini, kita akan mencoba melakukan analisa data pada penelitian case control study dimana analisis univariat menggunakan nilai odds ratio dan analisis
LEMBAR PENJELASAN KEPADA RESPONDEN. Saya bernama Desi Handayani Lubis adalah mahasiswa S2 Program Studi
 Lampiran 1. LEMBAR PENJELASAN KEPADA RESPONDEN Saya bernama Desi Handayani Lubis adalah mahasiswa S2 Program Studi Pascasarjana Ilmu Kesehatan Masyarakat Fakultas Kesehatan Masyarakat Universitas Sumatera
Analisis Data Panel Tidak Lengkap Model Komponen Error Dua Arah dengan Metode Minimum Variance Quadratic Unbiased Estimation (MIVQUE) SKRIPSI
 SKRIPSI") Analisis Data Panel Tidak Lengkap Model Komponen Error Dua Arah dengan Metode Minimum Variance Quadratic Unbiased Estimation (MIVQUE) (Studi Kasus Model Return Saham Di BEJ) SKRIPSI Oleh: RATIH DWI ASTUTI
Analisis Data Panel Tidak Lengkap Model Komponen Error Dua Arah dengan Metode Minimum Variance Quadratic Unbiased Estimation (MIVQUE) (Studi Kasus Model Return Saham Di BEJ) SKRIPSI Oleh: RATIH DWI ASTUTI
ANALYSIS OF VARIANCE (ANOVA)
") ANALYSIS OF VARIANCE (ANOVA) Pendahuluan ANOVA Uji dengan ANOVA Post hoc procedure Materi Kuliah PENDAHULUAN Jika uji t digunakan untuk membandingkan ratarata/parameter sampel ANOVA digunakan untuk membandingkan
ANALYSIS OF VARIANCE (ANOVA) Pendahuluan ANOVA Uji dengan ANOVA Post hoc procedure Materi Kuliah PENDAHULUAN Jika uji t digunakan untuk membandingkan ratarata/parameter sampel ANOVA digunakan untuk membandingkan
PENGARUH GAYA HIDUP TERHADAP KEJADIAN HIPERTENSI DI RSUD Dr. H. KUMPULAN PANE TEBING TINGGI
 Lampiran 1 KUESIONER PENELITIAN PENGARUH GAYA HIDUP TERHADAP KEJADIAN HIPERTENSI DI RSUD Dr. H. KUMPULAN PANE TEBING TINGGI I. Identitas Responden 1. Nomor : 2. Nama : 3. Umur : 4. Jenis Kelamin : 5. Pendidikan
FORMULIR PERSETUJUAN MENJADI PESERTA PENELITIAN (INFORMED CONSENT)
") Lampiran 1 FORMULIR PERSETUJUAN MENJADI PESERTA PENELITIAN (INFORMED CONSENT) Nama Judul Penelitian : Helena Verawaty Tarigan :Faktor Risiko Gagal Ginjal Kronis pada Pasien yang Menjalani Terapi Haemodialisa
Lampiran 1 FORMULIR PERSETUJUAN MENJADI PESERTA PENELITIAN (INFORMED CONSENT) Nama Judul Penelitian : Helena Verawaty Tarigan :Faktor Risiko Gagal Ginjal Kronis pada Pasien yang Menjalani Terapi Haemodialisa
KUESIONER. a. Nama Responden : b. AlamatResponden : c. Jenis kelamin : d. Umur Responden : e. Pekerjaan : 1. Bekerja 2.
 Lampiran 1. KUESIONER HUBUNGAN KUALITAS UDARA AMBIEN DENGAN KELUHAN GANGGUAN PERNAFASAN PADA MASYARAKAT SEKITAR PABRIK GULA SEI SEMAYANG (PGSS) KABUPATEN DELI SERDANG TAHUN 2014 No. Responden : Tanggal
PEMODELAN REGRESI LINIER MULTIVARIAT DENGAN METODE PEMILIHAN MODEL FORWARD SELECTION
 PEMODELAN REGRESI LINIER MULTIVARIAT DENGAN METODE PEMILIHAN MODEL FORWARD SELECTION DAN ALL POSSIBLE SUBSET SELECTION PADA JUMLAH KEMATIAN BAYI DAN INDEKS PEMBANGUNAN MANUSIA (IPM) ( Studi Kasus di Provinsi
KUESIONER PENELITIAN PENGARUH PENGETAHUAN DAN MOTIF EKONOMI TERHADAP PENGGUNAAN FORMALIN DAN BORAKS OLEH PEDAGANG
 Lampiran 1. Kuesioner Penelitian KUESIONER PENELITIAN PENGARUH PENGETAHUAN DAN MOTIF EKONOMI TERHADAP PENGGUNAAN FORMALIN DAN BORAKS OLEH PEDAGANG DALAM PANGAN SIAP SAJI (BAKSO) DI MEDAN DENAI DAN MEDAN
Statistics for Managers Using Microsoft Excel Chapter 1 Introduction and Data Collection
 Statistics for Managers Using Microsoft Excel Chapter 1 Introduction and Data Collection 1999 Prentice-Hall, Inc. Chap. 1-1 Statistik untuk Para Menejer 1. Untuk mengetahui tingkat pengembalian investasi.
DAFTAR ISI.. LEMBAR PENGESAHAN SURAT PERNYATAAN ABSTRAK.. ABSTRACT... DAFTAR TABEL.. DAFTAR PERSAMAAN..
 ABSTRAK Perkembangan teknologi yang semakin pesat, membuat semakin sedikitnya suatu industri yang memakai operator dalam menjalankan suatu proses produksi. Pada saat ini, kontrol otomatis lebih banyak
PENDEKATAN REGRESI BERGANDA PADA ANALISIS VARIANS KLASIFIKASI DUA ARAH SKRIPSI ERNI SYAHPUTRI
 PENDEKATAN REGRESI BERGANDA PADA ANALISIS VARIANS KLASIFIKASI DUA ARAH SKRIPSI ERNI SYAHPUTRI 090823074 DEPARTEMEN MATEMATIKA FAKULTAS MATEMATIKA DAN ILMU PENGETAHUAN ALAM UNIVERSITAS SUMATERA UTARA MEDAN
Pemrograman Lanjut. Interface
 Pemrograman Lanjut Interface PTIIK - 2014 2 Objectives Interfaces Defining an Interface How a class implements an interface Public interfaces Implementing multiple interfaces Extending an interface 3 Introduction
LAMPIRAN 5. Gambaran Umum Responden
 148 LAMPIRAN 5 Gambaran Umum Responden 149 Frequencies N Valid Missing Statistics Pendidikan JenisKelamin Usia Terakhir MasaKerja 45 45 45 45 0 0 0 0 Frequency Table Valid Laki-laki Perempuan Total JenisKelamin
FORMULIR RESPONDEN PENELITIAN. 5. Riwayat Penyakit Dahulu : DM/HT/Jantung/ Ginjal/ lainnya: BMI :... BB:...kg TB:...cm
 LAMPIRAN FORMULIR RESPONDEN PENELITIAN 1. No. RM :... 2. Jenis kelamin : L/P 3. Usia :... tahun 4. Status ASA : I/II 5. Riwayat Penyakit Dahulu : DM/HT/Jantung/ Ginjal/ lainnya:... 6. Diagnosis pre operasi
Resume 2 : Analysis of sex sequences by means of generalized linear mixed models. Yenni Angraini G
 Resume 2 : Analysis of sex sequences by means of generalized linear mixed models Roberto Ambrosini, Diego Rubolini, Nicola Saino Yenni Angraini G161150051 Eksplorasi Data Data Simulasi proportion of male
PERSEMBAHAN. Karya ini dipersembahkan untuk ibu, bapak, dan kakak yang selalu mendoakan dan memotivasiku untuk terus berjuang menyelesaikan skripsi.
 ABSTRAK Shaifudin Zuhdi. 2015. KOMPUTASI METODE NEWTON RAPHSON DENGAN SOFTWARE R UNTUK ESTIMASI PARAMETER MODEL REGRESI LOGISTIK ORDINAL TERBOBOTI SECARA GEOGRAFIS (RLOTG). Fakultas Matematika dan Ilmu
ABSTRACT. Keywords: tax refund, fees for acquisition of land and buildings from sell-buy transaction. viii. Universitas Kristen Maranatha
 ABSTRACT This research entitled Effect of Transfer of Fees for Acquisition of Land and Building Being Against Local Tax Refund of Fees on Acquisition of Land and Building from Sell-Buy Transaction at Tax
KUESIONER PENELITIAN
 KUESIONER PENELITIAN PENGARUH LINGKUNGAN, KELUARGA DAN PEER GROUP TERHADAP PERILAKU SEKS PRANIKAH PADA REMAJA DI LOKASI WISATA PEMANDIAN Tj SELAMAT KAB. DELISERDANG A. Indentitas Responden 1. Nomor :.
Prosiding Statistika ISSN:
 Prosiding Statistika ISSN: 2460-6456 Distribusi Binomial Negatif-Lindley pada Data Frekuensi Klaim Asuransi Kendaraan Bermotor di Indonesia Binomial Negative-Lindley Distribution in the Frequency Data
Optimalisasi Jumlah Batu Bata yang Pecah Menggunakan Desain Eksperimen Taguchi. (Studi Kasus: Usaha Batu Bata Bapak Kholil Ds.
 Optimalisasi Jumlah Batu Bata yang Pecah Menggunakan Desain Eksperimen Taguchi (Studi Kasus: Usaha Batu Bata Bapak Kholil Ds. Bulak Karangawen) SKRIPSI Disusun Oleh: CAKRA KURNIAWAN J2E 009 042 JURUSAN
KUESIONER PENGARUH KARAKTERISTIK KADER TERHADAP PELAKSANAAN PENIMBANGAN BALITA DI POSYANDU KABUPATEN PIDIE NANGGRO ACEH DARUSSALAM TAHUN 2010
 Lampiran 3 KUESIONER PENGARUH KARAKTERISTIK KADER TERHADAP PELAKSANAAN PENIMBANGAN BALITA DI POSYANDU KABUPATEN PIDIE NANGGRO ACEH DARUSSALAM TAHUN 2010 A. Karakteristik Responden No. Responden :.. - Umur
PERBANDINGAN MODEL ARIMA DAN MODEL REGRESI DENGAN RESIDUAL ARIMA DALAM MENERANGKAN PERILAKU PELANGGAN LISTRIK DI KOTA PALOPO
 Perbandingan Model ARIMA... (Alia Lestari) PERBANDINGAN MODEL ARIMA DAN MODEL REGRESI DENGAN RESIDUAL ARIMA DALAM MENERANGKAN PERILAKU PELANGGAN LISTRIK DI KOTA PALOPO Alia Lestari Fakultas Teknik Universitas
DISAIN EKSPERIMENTAL STATISTIKA TEKNIK KIMIA
 DISAIN EKSPERIMENTAL STATISTIKA TEKNIK KIMIA LNK@2017 REFERENCE#1 GEORGE E. P. BOX, PhD, DSc, is Ronald Aylmer Fisher Professor Emeritus of Statistics and Industrial Engineering at the University of Wisconsin
I. Identitas Responden 1. No. Responden : Nama responden : Jumlah anak :... (orang) 4. Pendidikan : Umur :...
 4. Pendidikan : Umur :...") 85 Lampiran 1. Kuesioner Penelitian FAKTOR-FAKTOR YANG BERHUBUNGAN DENGAN PENGGUNAAN ALAT KONTRASEPSI DALAM RAHIM (AKDR) PADA PASANGAN SUAMI ISTRI DI DESA DURIN JANGAK KECAMATAN PANCUR BATU KABUPATEN DELI
85 Lampiran 1. Kuesioner Penelitian FAKTOR-FAKTOR YANG BERHUBUNGAN DENGAN PENGGUNAAN ALAT KONTRASEPSI DALAM RAHIM (AKDR) PADA PASANGAN SUAMI ISTRI DI DESA DURIN JANGAK KECAMATAN PANCUR BATU KABUPATEN DELI
REGRESI LOG-LOGISTIK UNTUK DATA TAHAN HIDUP TERSENSOR TIPE I. oleh NANDA HIDAYATI M
 REGRESI LOG-LOGISTIK UNTUK DATA TAHAN HIDUP TERSENSOR TIPE I oleh NANDA HIDAYATI M0108098 SKRIPSI ditulis dan diajukan untuk memenuhi sebagian persyaratan memperoleh gelar Sarjana Sains Matematika JURUSAN
Variabel selain variabel dalam eksperimen (IV dan DV) yang bisa berpengaruh pada pemberian perlakuan pada subyek
 yang bisa berpengaruh pada pemberian perlakuan pada subyek") basic of experiments Terminologi dalam rancangan eksperimen Treatment Group Control Group Variable Extraneous variables Factor Level Randomness, Random assignment Ex post facto Variance internal validity
basic of experiments Terminologi dalam rancangan eksperimen Treatment Group Control Group Variable Extraneous variables Factor Level Randomness, Random assignment Ex post facto Variance internal validity
PENERAPAN REGRESI LINIER MULTIVARIAT PADA DISTRIBUSI UJIAN NASIONAL 2014 (Studi Kasus Nilai Ujian Nasional 2014 SMP Negeri 1 Sayung)
") PENERAPAN REGRESI LINIER MULTIVARIAT PADA DISTRIBUSI UJIAN NASIONAL 2014 (Studi Kasus Nilai Ujian Nasional 2014 SMP Negeri 1 Sayung) SKRIPSI Oleh : VICA NURANI 24010211130033 JURUSAN STATISTIKA FAKULTAS
PENERAPAN REGRESI LINIER MULTIVARIAT PADA DISTRIBUSI UJIAN NASIONAL 2014 (Studi Kasus Nilai Ujian Nasional 2014 SMP Negeri 1 Sayung) SKRIPSI Oleh : VICA NURANI 24010211130033 JURUSAN STATISTIKA FAKULTAS
Statistika Industri II TIP - FTP UB
 Statistika Industri II TIP - FTP UB Mirip regresi linier berganda Metode dependen Dimana : Variabel Independen (X1 dan seterusnya) adalah data metrik, yaitu data berskala interval atau rasio. Variabel
LAMPIRAN. Lampiran 1. Ethical clearance
 LAMPIRAN Lampiran 1. Ethical clearance 69 Lampiran 2. Ijin penelitian 70 71 Lampiran 3. Informed consent JUDUL PENELITIAN : HUBUNGAN ABNORMALITAS HASIL CT-SCAN DENGAN DEVELOPMENTAL DELAYED PADA PASIEN
KUESIONER FAKTOR-FAKTOR YANG BERPENGARUH DENGAN RENDAHNYA PEMANFAATAN JAMPERSAL DI PUSKESMAS NAMORAMBE DAN PERSEPSI MASYARAKAT TERHADAP JKN
 KUESIONER FAKTOR-FAKTOR YANG BERPENGARUH DENGAN RENDAHNYA PEMANFAATAN JAMPERSAL DI PUSKESMAS NAMORAMBE DAN PERSEPSI MASYARAKAT TERHADAP JKN Identitas Responden 1. Nama :... 2. Umur :... 3. Pendidikan :...
ANALISIS VARIAN DUA FAKTOR DALAM RANCANGAN PENGAMATAN BERULANG ( REPEATED MEASURES )
") ANALISIS VARIAN DUA FAKTOR DALAM RANCANGAN PENGAMATAN BERULANG ( REPEATED MEASURES ) SKRIPSI Disusun Oleh: ALIF HARTATI J2E009036 JURUSAN STATISTIKA FAKULTAS SAINS DAN MATEMATIKA UNIVERSITAS DIPONEGORO
ANALISIS VARIAN DUA FAKTOR DALAM RANCANGAN PENGAMATAN BERULANG ( REPEATED MEASURES ) SKRIPSI Disusun Oleh: ALIF HARTATI J2E009036 JURUSAN STATISTIKA FAKULTAS SAINS DAN MATEMATIKA UNIVERSITAS DIPONEGORO
ESTIMASI PARAMETER DAN INTERVAL KREDIBEL DENGAN MODEL REGRESI LINIER BERGANDA BAYESIAN
 ESTIMASI PARAMETER DAN INTERVAL KREDIBEL DENGAN MODEL REGRESI LINIER BERGANDA BAYESIAN Vania Mutiarani a, Adi Setiawan b, Hanna Arini Parhusip c a Program Studi Matematika FSM UKSW Jl. Diponegoro 52-6
Apa itu suatu Hypothesis?
 Chapter 7 Student Lecture Notes 7-1 Dasar Dasar Hipotesis Apa itu suatu Hypothesis? Hypothesis adalah suatu pernyataan (asumsi) tentang parameter populasi I nyatakan rata-rata IPK kelas ini = 3.5! Contoh
3. Lama bekerja sebagai PSK.Tahun
 KUESIONER HUBUNGAN SOSIODEMOGRAFI, PENGETAHUAN, DAN SIKAP PEKERJA SEKS KOMERSIAL TERHADAP UPAYA PENCEGAHAN HIV/AIDS DI KECAMATAN BANGKO KABUPATEN ROKAN HILIR PROPINSI RIAU Hari/Tanggal : Waktu : Pukul...
ANALISIS DATA KATEGORI DENGAN LOG LINIER MENGGUNAKAN PRINSIP HIRARKI (STUDI KASUS JUMLAH KECELAKAAN LALU LINTAS DI KOTA MAKASSAR TAHUN 2011).
.") ANALISIS DATA KATEGORI DENGAN LOG LINIER MENGGUNAKAN PRINSIP HIRARKI (STUDI KASUS JUMLAH KECELAKAAN LALU LINTAS DI KOTA MAKASSAR TAHUN 2011). Try Azisah Nurman Dosen Pada Jurusan Matematika, Fakultas Sains
ANALISIS DATA KATEGORI DENGAN LOG LINIER MENGGUNAKAN PRINSIP HIRARKI (STUDI KASUS JUMLAH KECELAKAAN LALU LINTAS DI KOTA MAKASSAR TAHUN 2011). Try Azisah Nurman Dosen Pada Jurusan Matematika, Fakultas Sains
Instrumen Penelitian Kuisioner
 Lampiran 1 : Instrumen Penelitian Kuisioner PENGARUH PENGAWASAN DAN KEPATUHAN TERHADAP PENGGUNAAN ALAT PELINDUNG DIRI PADA PERAWAT DALAM PENCEGAHAN INFEKSI NOSOKOMIAL DI RUMAH SAKIT UMUM DAERAH KISARAN
Statistik Bisnis. Week 9 Confidence Interval Estimation
 Statistik Bisnis Week 9 Confidence Interval Estimation Agenda Time Activity 20 minutes Point and Interval Estimate 40 minutes Confidence Interval Estimate for the Mean ( Known) 40 minutes Confidence Interval
Senyawa Pembanding Parasetamol Dosis 50 mg/kgbb
 50 LAMPIRAN A HASIL PENGAMATAN WAKTU RESPON MENCIT TERHADAP STIMULASI PANAS PADA KELOMPOK SENYAWA UJI KLOROBENZOIL)PARASETAMOL DAN SENYAWA PEMBANDING PARASETAMOL Senyawa Pembanding Parasetamol Dosis 25
METODE LENTH PADA RANCANGAN FAKTORIAL FRAKSIONAL DENGAN ESTIMASI EFEK ALGORITMA YATES
 METODE LENTH PADA RANCANGAN FAKTORIAL FRAKSIONAL DENGAN ESTIMASI EFEK ALGORITMA YATES SKRIPSI Disusun oleh : MUTIARA ARDIN RIFKIANI 24010211140102 JURUSAN STATISTIKA FAKULTAS SAINS DAN MATEMATIKA UNIVERSITAS
ABSTRAK. semua ditentukan oleh kualitas dari sumber daya manusia yang terdapat di suatu perusahaan
 ABSTRAK Dalam suatu organisasi atau perusahaan sumber daya manusia merupakan elemen penting, yang perannya sebagai penggerak pemasaran, operasional, finansial. Akan tetapi itu semua ditentukan oleh kualitas
1/5. while and do Loops The remaining types of loops are while and do. As with for loops, while and do loops Praktikum Alpro Modul 3.
 Judul TIU TIK Materi Modul Perulangan Ganjil 204/205 Mahasiswa memahami Konsep Perulangan. Mahasiswa mampu menggunakan perintah perulangan For, While do, do While 2. Mahasiswa mampu menggunakan perintah
KUESIONER PENELITIAN PENGARUH FAKTOR INTERNAL DAN EKSTERNAL IBU TERHADAP PEMBERIAN MP-ASI PADA ANAK USIA 0-6 BULAN DI KOTA LANGSA TAHUN 2010
 KUESIONER PENELITIAN PENGARUH FAKTOR INTERNAL DAN EKSTERNAL IBU TERHADAP PEMBERIAN MP-ASI PADA ANAK USIA 0-6 BULAN DI KOTA LANGSA TAHUN 00 I. Karakteristik Responden a. Nomor : b. Tanggal Penelitian :
DIFFUSION TEST AS AN ALTERNATIVE INDICATOR FOR DURABILITY ASSESSMENT OF BITUMINOUS MIXTURES THESIS
 T 615. 957 KC1 S DIFFUSION TEST AS AN ALTERNATIVE INDICATOR FOR DURABILITY ASSESSMENT OF BITUMINOUS MIXTURES THESIS by AINE KUSUMAWATI 26997032 PROGRAM SISTEM DAN TEKNIK JALAN RAYA PROGRAM PASCASARJANA
FIXED, RANDOM & MIXED MODELS. Senin, 12 November 2012
 FIXED, RANDOM & MIXED MODELS Senin, 12 November 2012 Outline s Introduction Single Factor Models Two Factor Models EMS (Expected Mean Square) Rules The Pseudo-F Test Introduction Setiappeneliti sebelumme-running
Lampiran 1 Kuesioner Penelitian Yth. Responden Dalam rangka memenuhi penelitian, saya sebagai mahasiswa Universitas Katolik Widya Mandala Surabaya,
 Lampiran 1 Kuesioner Penelitian Yth. Responden Dalam rangka memenuhi penelitian, saya sebagai mahasiswa Universitas Katolik Widya Mandala Surabaya, sangat mengharapkan kesediaan Bapak/Ibu/Sdr/i meluangkan
Universitas Sumatera Utara
 87 Lampiran 2 KUESIONER PENGARUH DUKUNGAN GURU DAN TEMAN SEBAYA TERHADAP AKSEPTABILITAS DAN PEMANFAATAN PUSAT INFORMASI KONSELING REMAJA (PIK REMAJA) PADA SISWA SMU NEGRI 2 KOTA TANJUNG BALAI TAHUN 2015
JURUSAN TEKNIK SIPIL FT UJB NINDYOCAHYOKRESNANTO.WORDPRESS.COM
 DR. NINDYO CAHYO KRESNANTO JURUSAN TEKNIK SIPIL FT UJB NINDYOCAHYOKRESNANTO.WORDPRESS.COM NINDYO_ CK@STAFF. JANABADRA. AC. ID (a+b)(a-b) = (a 2 -b 2 ) Subtitusi b = a (a + a)(a -a) = a 2 -a 2 (a + a)(a
ESTIMAS) PARAMETER REGRES) LINtER BERGANDA DENGAN METODE ROBUST BERDASARKAN LEAST TRIMMED SQUARES SKRIPSI
 PARAMETER REGRES) LINtER BERGANDA DENGAN METODE ROBUST BERDASARKAN LEAST TRIMMED SQUARES SKRIPSI") - E S 1! I\J! A:r! (Y-' f.} 1JC () ~'I OU-r LIe: f2- S ( s, fa-; 1(.11 (S ) InP/IJ...;23 lor UlI.!.e _ ESTIMAS) PARAMETER REGRES) LINtER BERGANDA DENGAN METODE ROBUST BERDASARKAN LEAST TRIMMED SQUARES
- E S 1! I\J! A:r! (Y-' f.} 1JC () ~'I OU-r LIe: f2- S ( s, fa-; 1(.11 (S ) InP/IJ...;23 lor UlI.!.e _ ESTIMAS) PARAMETER REGRES) LINtER BERGANDA DENGAN METODE ROBUST BERDASARKAN LEAST TRIMMED SQUARES